top of page


Infographics Summary
Global Artificial Intelligence Competitiveness Index
Reports
Educational Background of AI Professionals by Major
AI Enterprises vs Unicorns by Country
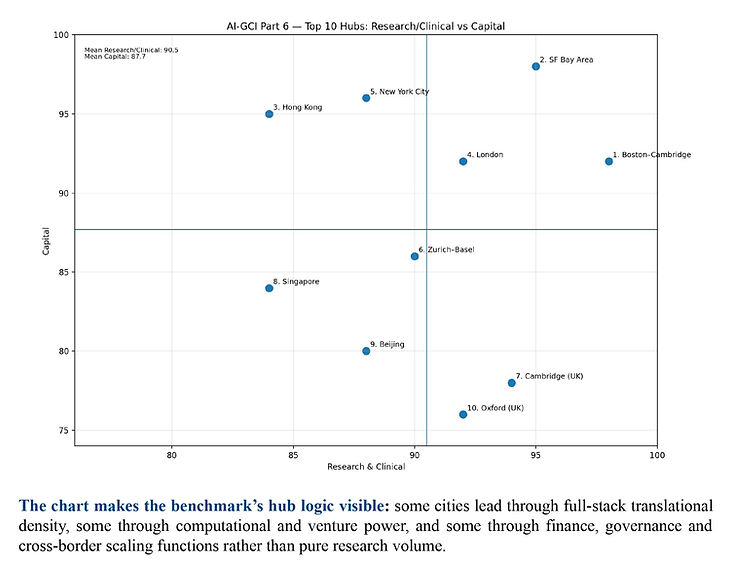
Part 6
Infographics Summary
Global Artificial Intelligence Competitiveness Index
Part 6: Analyzing AI from a BioTech,
Healthcare and Longevity Perspective
The Project is developed
with technological support of
Deep Knowledge Group

%20Part%206%20-%20Analyzing%20AI%20from%20a.jpg)
%20Part%206%20-%20Analyzing%20AI%20from%20a.jpg)
%20Part%206%20-%20Analyzing%20AI%20from%20a.jpg)
%20Part%206%20-%20Analyzing%20AI%20from%20a.jpg)
%20Part%206%20-%20Analyzing%20AI%20from%20a.jpg)
%20Part%206%20-%20Analyzing%20AI%20from%20a.jpg)
%20Part%206%20-%20Analyzing%20AI%20from%20a.jpg)
%20Part%206%20-%20Analyzing%20AI%20from%20a.jpg)
%20Part%206%20-%20Analyzing%20AI%20from%20a.jpg)
%20Part%206%20-%20Analyzing%20AI%20from%20a.jpg)
%20Part%206%20-%20Analyzing%20AI%20from%20a.jpg)
%20Part%206%20-%20Analyzing%20AI%20from%20a.jpg)
%20Part%206%20-%20Analyzing%20AI%20from%20a.jpg)
%20Part%206%20-%20Analyzing%20AI%20from%20a.jpg)
%20Part%206%20-%20Analyzing%20AI%20from%20a.jpg)
%20Part%206%20-%20Analyzing%20AI%20from%20a.jpg)
%20Part%206%20-%20Analyzing%20AI%20from%20a.jpg)
%20Part%206%20-%20Analyzing%20AI%20from%20a.jpg)
%20Part%206%20-%20Analyzing%20AI%20from%20a.jpg)
%20Part%206%20-%20Analyzing%20AI%20from%20a.jpg)
%20Part%206%20-%20Analyzing%20AI%20from%20a.jpg)
%20Part%206%20-%20Analyzing%20AI%20from%20a.jpg)
%20Part%206%20-%20Analyzing%20AI%20from%20a.jpg)
%20Part%206%20-%20Analyzing%20AI%20from%20a.jpg)
%20Part%206%20-%20Analyzing%20AI%20from%20a.jpg)
%20Part%206%20-%20Analyzing%20AI%20from%20a.jpg)
%20Part%206%20-%20Analyzing%20AI%20from%20a.jpg)
%20Part%206%20-%20Analyzing%20AI%20from%20a.jpg)
%20Part%206%20-%20Analyzing%20AI%20from%20a.jpg)
%20Part%206%20-%20Analyzing%20AI%20from%20a.jpg)
%20Part%206%20-%20Analyzing%20AI%20from%20a.jpg)
%20Part%206%20-%20Analyzing%20AI%20from%20a.jpg)
%20Part%206%20-%20Analyzing%20AI%20from%20a.jpg)
%20Part%206%20-%20Analyzing%20AI%20from%20a.jpg)
%20Part%206%20-%20Analyzing%20AI%20from%20a.jpg)


Part 5
Infographics Summary
Global Artificial Intelligence Competitiveness Index
Part 5: Analyzing AI Competitiveness from a
Finance, Economy and Financial Services Perspective
The Project is developed
with technological support of
Deep Knowledge Group


Part 4
Infographics Summary
Global Artificial Intelligence Competitiveness Index
Part 4: Analyzing AI Competitiveness from the Policy,
Governance and Regulation Perspective
The Project is developed
with technological support of
Deep Knowledge Group
Global Landscape on AI Policy, Governance and Regulation


Figure 1: Global AI Governance Landscape: Distribution by Region
Figure 2: Types of Organizations in AI Governance


Figure 3: Regional Distribution of AI Governance Organizations by Type
Figure 4: Types of Organizations in AI Governance


Figure 5: AI Governance in Key Sectors
Figure 6: Global AI Governance Actors and Standards


Figure 7: Future Trends in AI Governance
Figure 8: AI Enterprises and Publications by Country


Figure 9: AI Talent Density — Professionals per Million
Figure 10: Total AI Startup Funding Comparison by Country/Region


Figure 11: AI Enterprises per Million People Comparison by Country/Region
Figure 12: AI Unicorns vs. Average Unicorn Financing by Country/Region


Figure 13: Talent-to-Industry Ratio Comparison by Country
Figure 14: Correlation Matrix — Pillar Indexes

Figure 15: Regional Similarity — AI Governance Ecosystem Clusters

Figure 16: Regional AI Governance Intensity Heatmap

Figure 17: Governance Index Composition by Pillar — Top 20 Countries
Global Trends on AI Policy, Governance and Regulation


Figure 18: Governance Activity vs. AI Outcomes (2025)
Figure 19: Policy Activity vs. AI Ecosystem Outcomes (2025)

Figure 20: Estimated U.S. Government AI Spending
(2020–2025)

Figure 21: Estimated China Government AI Spending
(2020–2025)


Figure 22: Estimated Japan Government AI Spending
(2020–2025)
Figure 23: Estimated South Korea Government AI Spending (2020–2025)


Figure 24: Estimated Canada Government AI Spending
(2020–2025)
Figure 25: Estimated Germany Government AI Spending
(2020–2025)


Figure 26: Estimated EU Public AI Spending (2020–2025)
Figure 27: AI Applications Across Key Sectors in Hong Kong

Figure 28: Hong Kong AI Governance and Regulatory Framework
AI National Industrial Strategies 2025–2035

Figure 29: National AI Industrial Strategy Focus by Region

Figure 30: Sectoral AI Policy Focus by Country

Figure 31: Comparative AI Strategy Attributes


Figure 32: Global Cumulative AI Strategy Launches (2018–2025)
Figure 33: Timeline of National AI Strategy Adoption
(2017–2025)

Figure 34: Distribution of National AI Policy & Governance Initiatives
EU AI Regulatory Framework & Initiatives


Figure 35: Risk Categories in AI Governance
Figure 36: AI Regulation Programs and Implementation Challenges


Figure 37: Implementation Challenges and the AI Act in the European Digital Ecosystem
Figure 38: Comparative AI Governance Frameworks
Part 2
Infographics Summary
Global Artificial Intelligence Competitiveness Index
Part 2: Analyzing AI Competitiveness From the Research Innovation Perspective
The Project is developed
with technological support of
Deep Knowledge Group
Number of AI research papers in various countries (selection of the top 30 countries/regions)
Top 30 countries/regions
globally for AI research papers
Top 30 journals for AI research papers


Average number of citations of papers from among the top 30 countries/regions globally in number of AI research papers
Average impact factors of journals published by the top 30 countries/regions globally in number of AI research papers

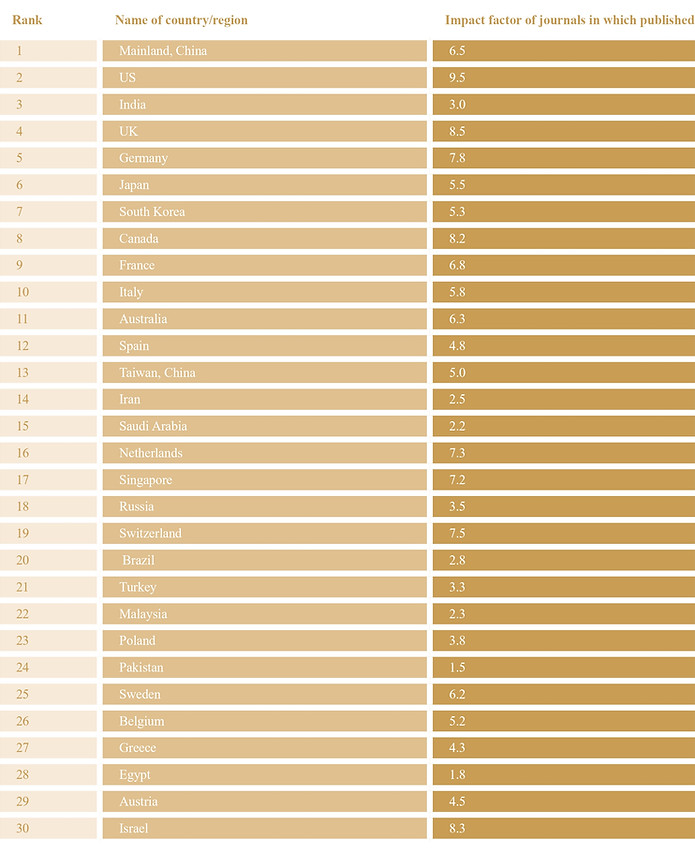
Impact values of the top 30 countries/regions in number of AI research papers worldwide
Top 30 Countries/Regions in AI Patents


Distribution of research topics published by the top 10 countries/regions globally for publishing AI papers
Top 15 AI Patent Holders Globally


Heat map of the top 30 countries/regions globally for AI research papers

Time series analysis
Number of papers published by the top 10 countries/regions globally for AI research papers

Number of papers published by the top 10 countries/regions globally for AI research papers(without Mainland, China)

Top 30 Countries Research Paper Impact Matrix Chart


Distribution of publishers in the top 10 countries/regions for publishing AI papers
Collaboration between authors from China and other leading AI paper publishing countries - Sankey diagram
Co-Occurrence Analysis of the Top 100 AI Patent Technologies from Leading Chinese AI Enterprises

Co-Occurrence Analysis of the Top 100 AI Patent Technologies from Leading U.S. AI Enterprises

Part 3
Infographics Summary
Global Artificial Intelligence Competitiveness Index
Part 3: Analyzing AI Competitiveness From the Human Capital Perspective
The Project is developed
with technological support of
Deep Knowledge Group
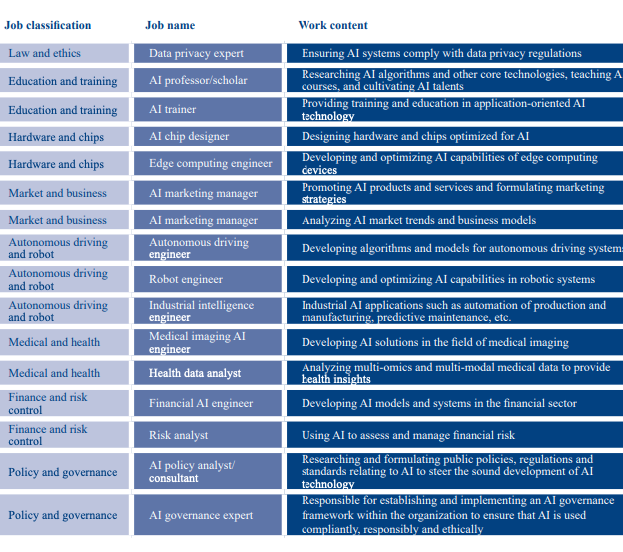
Overall classification and proportion of AI talent
Overall Classification of AI Talents

Global top 20 countries with AI talents

Global top 20 countries with AI talentsAI talent density in global top 20 countries

Distribution of majors studied by global AI talents


Top 10 Universities and employers of global AI talent graduates

Overall proportion of talents in different categories
Global AI talent job level distribution


Sankey diagram of the education work path for top AI talents worldwide

Distribution of working years
of global AI talents in the AI field
Distribution of educational background of global AI talents (postdoctoral non-education, single column)


Heat map of global top 20 countries with AI talents

Linear chart of the total number of global AI talents from 2020 to 2030 (millions of people)

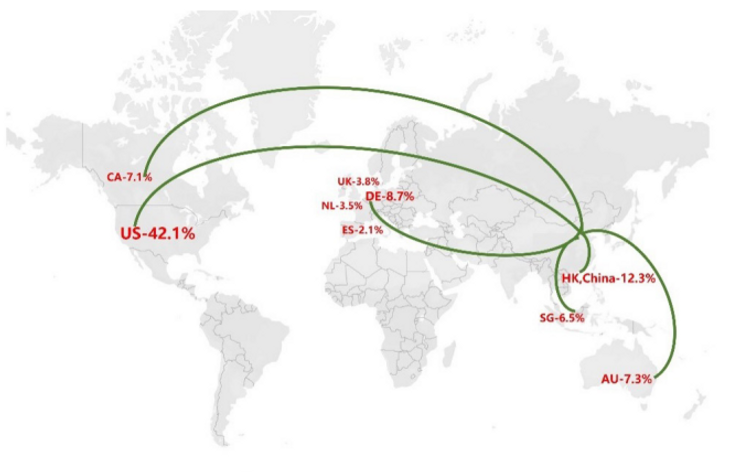
Distribution of countries of origin for overseas work experience of US AI talents
Distribution of countries of origin for overseas work experience of Mainland China AI talents

Part 1
Infographics Summary
Global Artificial Intelligence Competitiveness Index
Part 1: Analyzing AI Competitiveness From the Enterprise Perspective
The Project is developed
with technological support of
Deep Knowledge Group
Number of AI companies in each country (top 30 countries/regions selected)
Top 30 countries/regions in
number of AI companies worldwide
Top 10 countries/regions with the most
AI companies per million in population


Top 30 countries/regions in total financing amount of global AI startups (USD billion)
Distribution of countries with AI unicorns in the world


Global AI unicorn country financing and valuation regression analysis fitting slope results

Heat map of the number of AI companies in various countries (selecting the top 30 countries/regions)

Bar chart of time distribution of
global Al enterprise establishment
Top 30 countries/regions by total funding
amount for global AI startups (USD billion)


Distribution of AI companies founded in the top 30 countries in the world

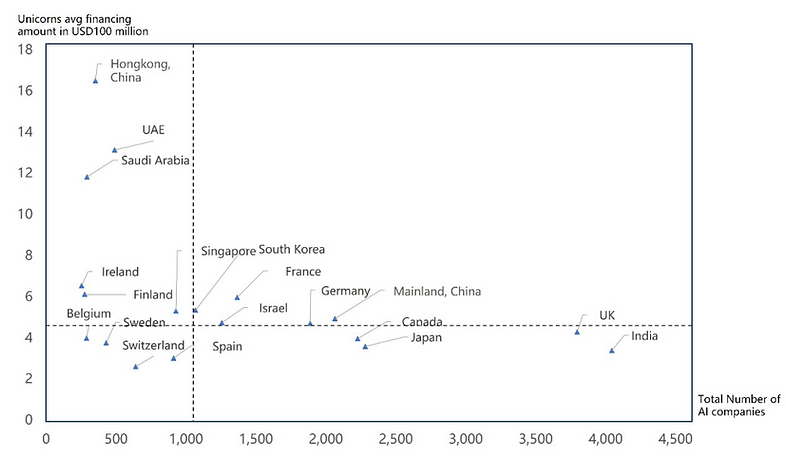
Global Al Unicorn Countries and Al Enterprise
Number Distribution Matrix
Regression analysis, of financing, and valuation,
of global AI unicorn countries

Regression analysis, of financing, and valuation, of global AI unicorn countries

Pie chart of industry distribution of global AI companies
Global AI enterprises’ products and services word cloud

Map of AI companies in major countries around the world (from Deep Knowledge Group)


bottom of page